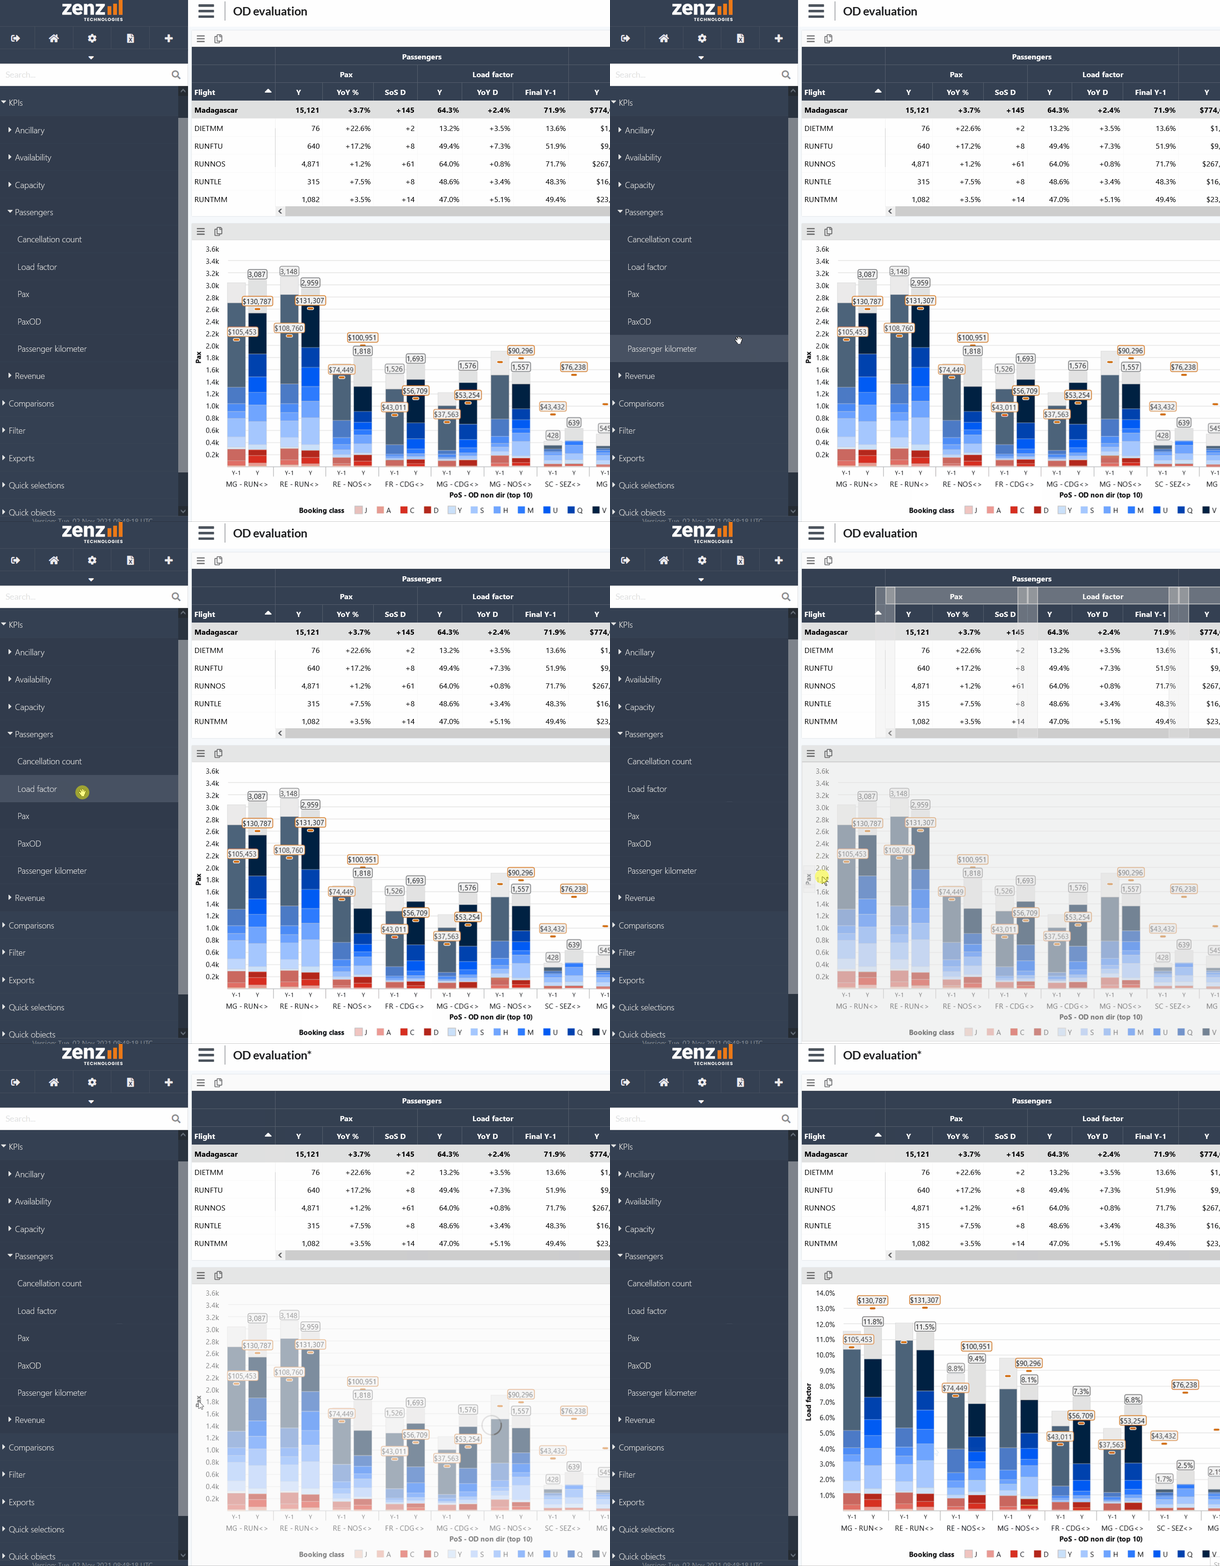
You can drag and drop KPIs and dimension from the sidebar on the left, but also from one graph to another. Examples:
Dragging a dimension such as from within a graph on another dimension in the same graph swaps the dimensions.
Dragging between objects replaces or adds the dimension. Example: drag ‘Load factor’ from the sidebar on top of ‘Pax’ in the graph to replace this KPI.
