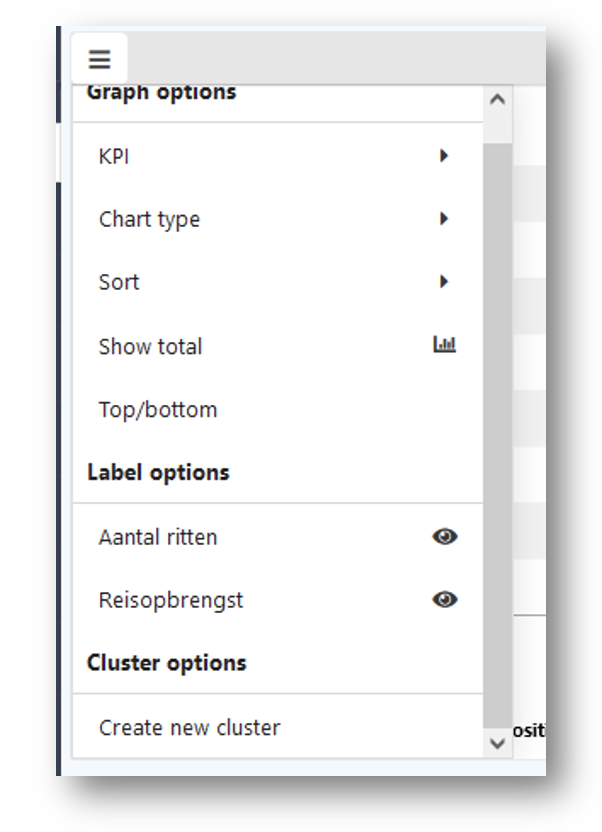
Chart types
- Bar, Line, Bubble or Waterfall
- Horizontal or vertical
Sorting options
Top/bottom
- For example, show only top 10 biggest propositions
- Can also be based on biggest difference (YoY)
Graph elements can be hidden
- Axis title, X-axis, Legend
- Convenient when you want to create more space
Label options
- To enable/disable labels click the eye icon per KPI
- For more specific label settings, click on the KPI to open the KPI label menu
